
Data Logger - Part 1 - Hardware
Introduction
This is the first in a series of posts to build a simple data logger system for temperature and relative humidity.
Three elements of system will be covered:
- Part 1 - Hardware - build a data logger for recording temperature and humidity using a Raspberry Pi
- Part 2 - Storage - send data to an Amazon Timestream database
- Part 3 - Visualization - viewing your data in a graphical form
This post is based on the Raspberry Pi Tutorial Raspberry Pi: Measure Humidity and Temperature with DHT11/DHT22.
Hardware
The hardware used:
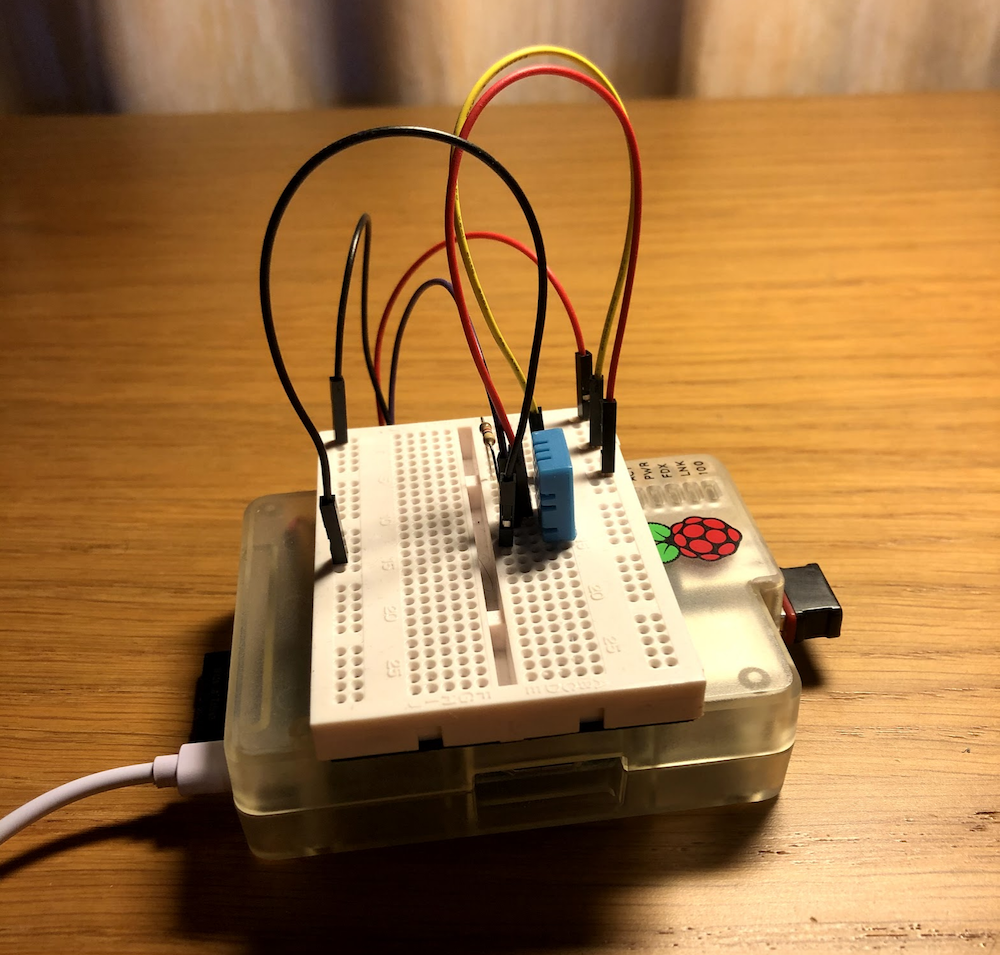
- Raspberry Pi 1 Model B
- DHT11 sensor
- Resistor 4.7kΩ ±5%
The finished data logger prototype looks like this:
Prerequisite Software
Raspberry Pi OS
$ lsb_release -a
No LSB modules are available.
Distributor ID:	Raspbian
Description:	Raspbian GNU/Linux 11 (bullseye)
Release:	11
Codename:	bullseye
Python
$ python3 --version
Python 3.9.2
Install Adafruit Python DHT
 $ sudo apt-get update

 $ sudo apt-get install python3-pip

 $ sudo python3 -m pip install --upgrade pip setuptools wheel

 $ sudo pip3 install Adafruit_DHT
Run the example script:
$ cd examples

$ sudo ./AdafruitDHT.py 11 4
Temp=22.0*  Humidity=58.0%
The first parameter (11) indicates which sensor was used (DHT11) and the second, to which GPIO it is connected (not the pin number, but the GPIO number).
Logging
The fields that will be logged are:
| Field | Description |
|---|---|
| Timestamp | UCT date and time |
| SensorId | Unique ID for the sensor |
| Location | Location of the sensor |
| Measurement | The mesaguement being logged “Temperature” or “Relative Humidity” |
| Value | Value measured by the sensor |
| Unit | Unit of measure “°C” or “%”” |
The example Python script logs the data collected every minute to the terminal and a csv file:
import time
import datetime
import csv
import Adafruit_DHT

DHT_TYPE = Adafruit_DHT.DHT11
DHT_PIN  = 4

FREQUENCY_SECONDS = 60
SENSOR_ID = '001'
SENSOR_LOCATION = 'Office'
DATA_FILE = 'data.txt'

def main():

    print('Logging sensor measurements to {0} every {1} seconds.'.format(DATA_FILE, FREQUENCY_SECONDS))
    print('Press Ctrl-C to quit.')

    write_file_header()

    while True:

        # Attempt to get sensor reading
        humidity, temperature = Adafruit_DHT.read(DHT_TYPE, DHT_PIN)

        # Skip to the next sensor reading if a valid measurement couldn't be taken
        if humidity is None or temperature is None:
            time.sleep(2)
            continue

        # Get the current time for the timestamp
        timestamp = datetime.datetime.now().isoformat()

        write_file_row(timestamp, 'Temperature', 'DegC', temperature)
        write_file_row(timestamp, 'Relative Humidity', '%', humidity)

        # Wait before taking next reading
        time.sleep(FREQUENCY_SECONDS)

def write_file_header():

    with open(DATA_FILE, 'w') as csvfile:
        fieldnames = ['Timestamp','SensorId','Location','Measurement','Value','Unit']
        writer = csv.DictWriter(csvfile, fieldnames=fieldnames)
        writer.writeheader()

    print('Timestamp                   SensorId  Location  Measurement        Value  Unit')
    print('---------                   --------  --------  -----------        -----  ----')

def write_file_row(timestamp, measurement, unit, value):

    with open(DATA_FILE, 'a') as csvfile:
        writer = csv.writer(csvfile)
        writer.writerow([timestamp, SENSOR_ID, SENSOR_LOCATION, measurement, str(value), unit])

    print(  timestamp + "  " +
            SENSOR_ID.ljust(8, ' ') + "  " +
            SENSOR_LOCATION.ljust(8, ' ') + "  " +
            measurement.ljust(18, ' ') + " " +
            str(value).ljust(6, ' ') + " " +
            unit )

if __name__ == '__main__':
    main()
Running the scripts gives the screen output:
$ python3 data_logger_part_1.py
Logging sensor measurements to data.txt every 60 seconds.
Press Ctrl-C to quit.
Timestamp                   SensorId  Location  Measurement        Value  Unit
---------                   --------  --------  -----------        -----  ----
2020-10-31T22:21:19.449756  001       Office    Temperature        23.0   DegC
2020-10-31T22:21:19.449756  001       Office    Relative Humidity  60.0   %
2020-10-31T22:22:32.691330  001       Office    Temperature        23.0   DegC
2020-10-31T22:22:32.691330  001       Office    Relative Humidity  66.0   %
2020-10-31T22:23:38.344769  001       Office    Temperature        22.0   DegC
2020-10-31T22:23:38.344769  001       Office    Relative Humidity  61.0   %
2020-10-31T22:24:38.938112  001       Office    Temperature        22.0   DegC
2020-10-31T22:24:38.938112  001       Office    Relative Humidity  61.0   %
2020-10-31T22:25:39.491975  001       Office    Temperature        22.0   DegC
2020-10-31T22:25:39.491975  001       Office    Relative Humidity  58.0   %
The csv file written looks like this:
$ cat data.txt
Timestamp,SensorId,Location,Measurement,Value,Unit
2020-10-31T22:21:19.449756,001,Office,Temperature,23.0,DegC
2020-10-31T22:21:19.449756,001,Office,Relative Humidity,60.0,%
2020-10-31T22:22:32.691330,001,Office,Temperature,23.0,DegC
2020-10-31T22:22:32.691330,001,Office,Relative Humidity,66.0,%
2020-10-31T22:23:38.344769,001,Office,Temperature,22.0,DegC
2020-10-31T22:23:38.344769,001,Office,Relative Humidity,61.0,%
2020-10-31T22:24:38.938112,001,Office,Temperature,22.0,DegC
2020-10-31T22:24:38.938112,001,Office,Relative Humidity,61.0,%
2020-10-31T22:25:39.491975,001,Office,Temperature,22.0,DegC
2020-10-31T22:25:39.491975,001,Office,Relative Humidity,58.0,%
Now we have data logging locally, the next part of the series will look at storing the data in a AWS Timestream database.
The code for this post is available on GitHub.