
COVID-19 - Ireland County Data
Introduction
The Irish government has made available several datasets relating to the COVID-19 pandemic. These are available at the Ireland’s COVID-19 Data Hub.
This example looks at how you can download and produce visualisations of the County Statistics datasets (Covid19CountyStatisticsHPSCIreland) using a Python script.
Libraries
The following libraries are used in the script:
- argparse - makes it easy to write user-friendly command-line interfaces buy handling command line parameters.
- requests - allows sending HTTP requests through Python, which will be used to obtain the dataset from the internet.
- pandas - open-source Python library that provides powerful data structures and data analysis tools to deal with datasets.
- matplotlib.pyplot - used for data visualisation.
- matplotlib.dates - used for date formatting on data visualisations.
import argparse
import requests
import pandas as pd
import matplotlib.pyplot as plt
import matplotlib.dates as mdates
Command Line Arguments
The scripts takes two parameters:
- county - the name of the county you want to plot data for
- days - the number of days data you want to plot
# Get command line arguments
parser = argparse.ArgumentParser()
parser.add_argument("--county", help="county name - default: Cork", default="Cork")
parser.add_argument("--days", help="number of days to display data for - default: 30", type=int, default="30")
args = parser.parse_args()
Get Dataset
The CSV version of the dataset is downloaded to the local file system.
# Get latest county date in csv format
filename = 'covid-ie-counties.csv'
data_url = 'https://opendata-geohive.hub.arcgis.com/datasets/d9be85b30d7748b5b7c09450b8aede63_0.csv?outSR=%7B%22latestWkid%22%3A3857%2C%22wkid%22%3A102100%7D'
data_content = requests.get(data_url).content
csv_file = open(filename, 'wb')
csv_file.write(data_content)
csv_file.close()
Filter Dataset
The CSV file is loaded into a pandas DataFrame and filtered by county name and the number of days to plot.
# Filter data by county and number of days
df = pd.read_csv(filename)
df = df.loc[df['CountyName'] == args.county].tail(args.days)
Format Date
When loaded into the dataframe the TimeStamp is a string, convert it into a datetime object for charting and formatting.
# Converting time stamp to a to datetime e.g. 2020/03/22 00:00:0
df['TimeStamp'] = pd.to_datetime(df['TimeStamp'], format='%Y/%m/%d %H:%M:%S')
Bar Chart - Cumulative Confirmed Cases By County
The cumulative confirmed cases are plotted using the TimeStamp and ConfirmedCovidCases fields in the DataFrame.
# Bar Chart - Cumulative Confirmed Cases By County
plt.bar(df["TimeStamp"], df["ConfirmedCovidCases"])
plt.xlabel('Date')
plt.ylabel('Total Cases')
plt.title('Cumulative Confirmed Cases for ' + args.county + ' for last ' + str(args.days) + ' days')
plt.gca().xaxis.set_major_formatter(mdates.DateFormatter('%d-%b'))
plt.gcf().autofmt_xdate()
plt.show()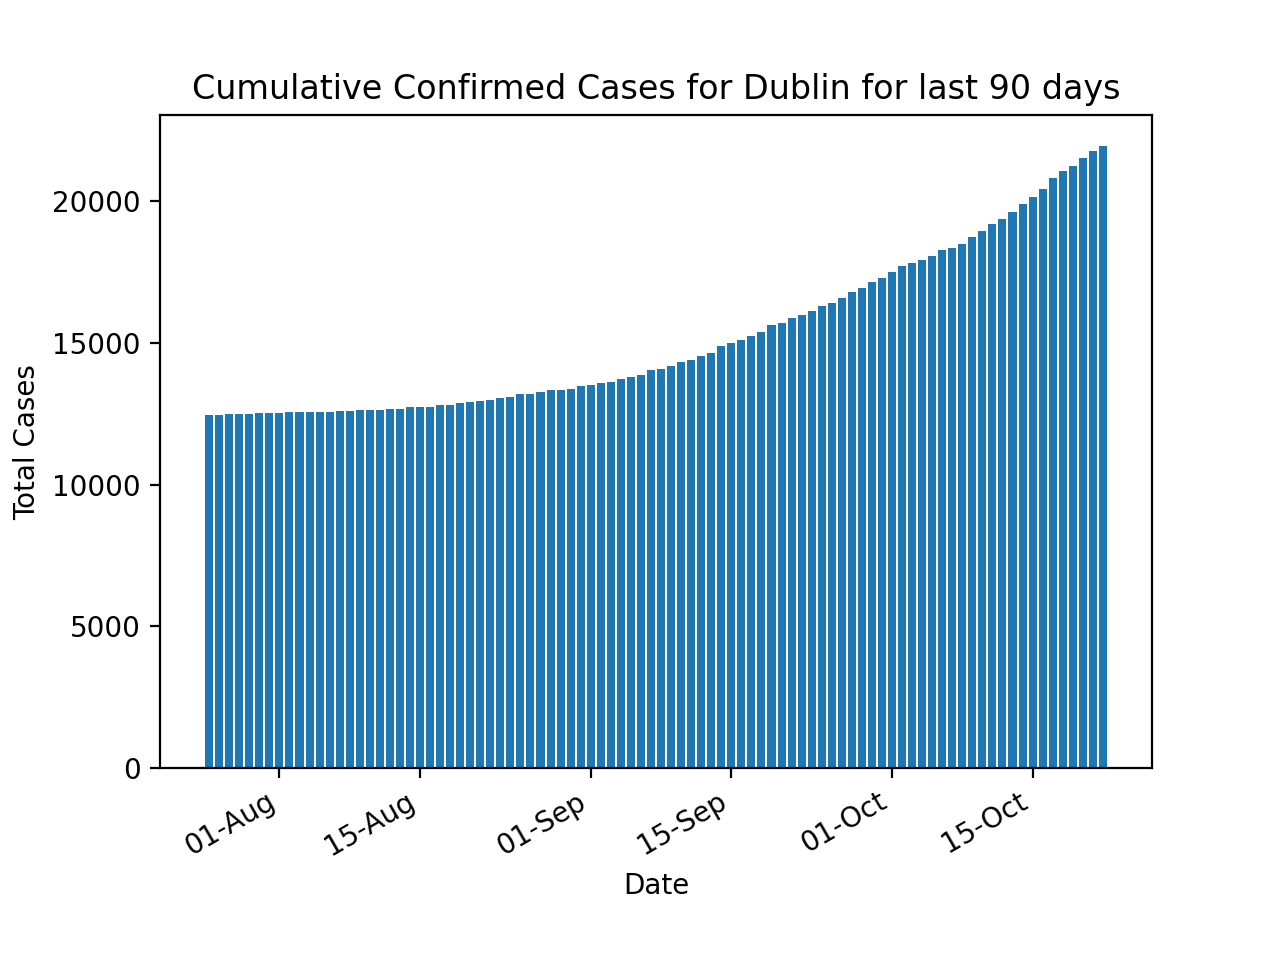
Bar Chart - New Confirmed Cases By County
The new daily confirmed cases are plotted using the TimeStamp and the diff method on ConfirmedCovidCases. The diff method calculates the difference of a DataFrame element compared with another element in the DataFrame (default is element in previous row).
# Bar Chart - New Confirmed Cases By County
plt.bar(df["TimeStamp"], df["ConfirmedCovidCases"].diff())
plt.xlabel('Date')
plt.ylabel('Confirmed Cases')
plt.title('New Confirmed Cases for ' + args.county + ' for last ' + str(args.days) + ' days')
plt.gca().xaxis.set_major_formatter(mdates.DateFormatter('%d-%b'))
plt.gcf().autofmt_xdate()
plt.show()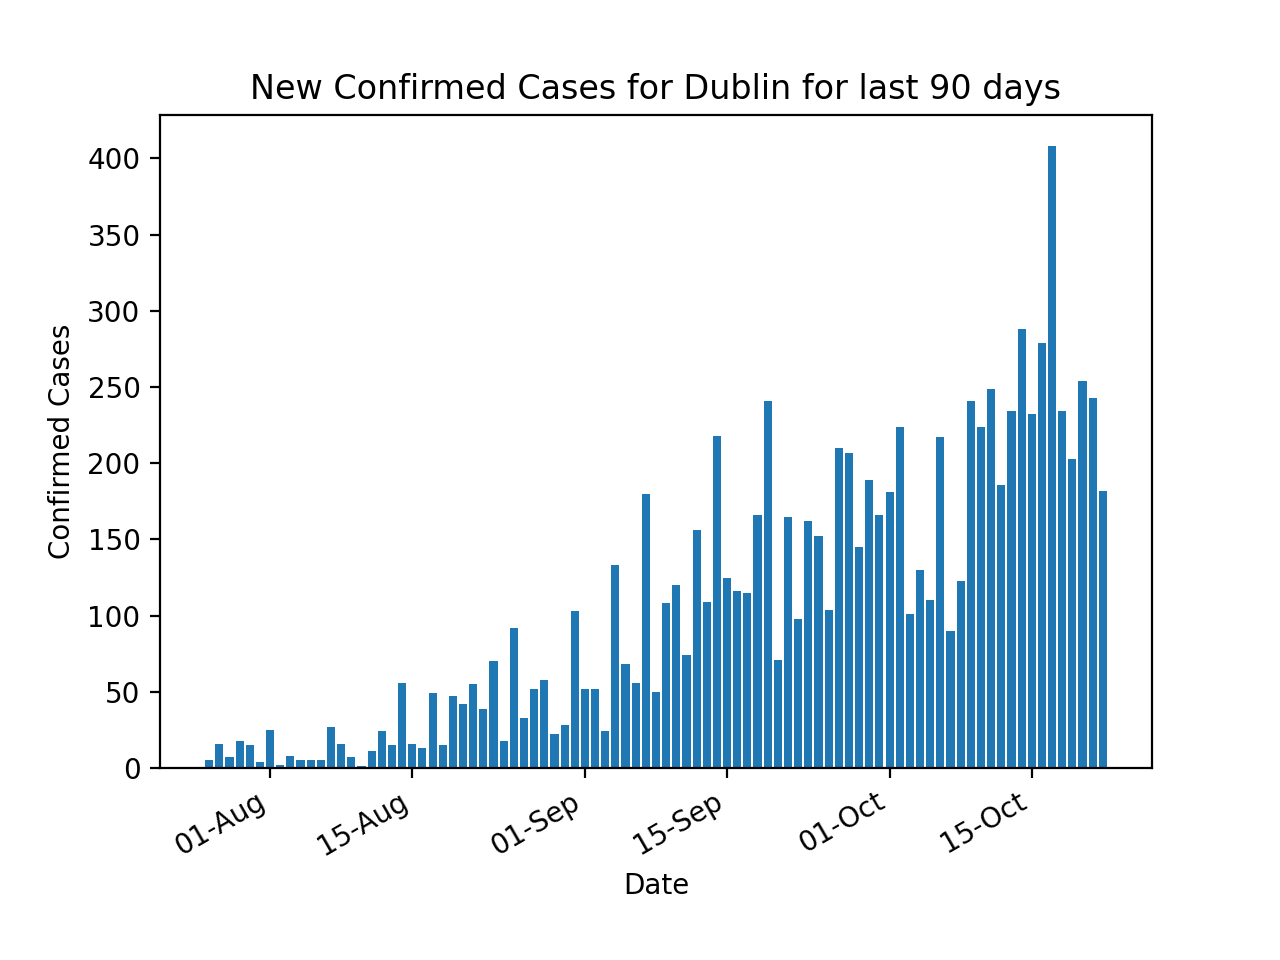
Usage
Help for parameters can be viewed by:
$ python3 covid-ie-counties.py --help
usage: covid-ie-counties.py [-h] [--county COUNTY] [--days DAYS]

optional arguments:
  -h, --help       show this help message and exit
  --county COUNTY  county name - default: Cork
  --days DAYS      number of days to display data for - default: 30
This is an example of the command to plot the previous 30 days of data for county Dublin:
$ python3 covid-ie-counties.py --county Dublin --days 30Conclusion
This is just one example of what can be done with the datasets available from the Ireland’s COVID-19 Data Hub.
Full code for this example available on GitHub here.